
When a powerful hurricane scrapes a coastline without crossing it, the distinction between “near miss” and “disaster” hinges on mechanics the public rarely sees: wind maxima at sea, rain and surf driven ashore, and a track that stays just offshore yet still tests a region’s resilience.
At a Glance
- Hurricane Simon reached Category 4 intensity and passed close to Mexico’s west-central coast on October 11, 2026, with its eye offshore.
- Satellite imagery pinned the center roughly 50 kilometers from shore between Manzanillo and Puerto Vallarta during its close approach.
- Official advisories documented subsequent fluctuations and weakening while the storm remained west of Cabo Corrientes.
- Coastal hazards—heavy rain, flooding, mudslide risk, and dangerous swells—materialized even without a confirmed landfall.
What the records establish: a high-end hurricane paralleling the coast
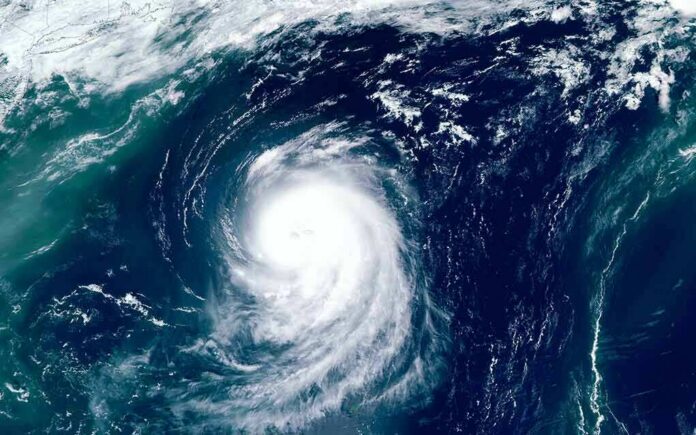
Authoritative observational records converge on a clear sequence. NASA’s Earth Observatory reported that Simon passed close to Mexico’s coast as a Category 4 hurricane on October 11, 2026. At roughly 2:30 p.m. local time that day, a Suomi NPP VIIRS overpass captured a well-defined eye about 50 kilometers offshore between Manzanillo and Puerto Vallarta. NASA described peak sustained winds of about 250 kilometers per hour (155 mph), while winds near the overpass time were closer to 210 kilometers per hour (130 mph)—both consistent with major hurricane status by the Saffir–Simpson scale.
As the event evolved, the National Hurricane Center’s public advisories placed the center west of Cabo Corrientes and documented the storm’s changing intensity. Advisory snapshots on October 13 located Simon about 110 to 125 miles west of Cabo Corrientes, with maximum sustained winds reported between 90 and 110 mph, reflecting a storm that had weakened from its earlier peak while remaining offshore. The NHC’s archived advisory package for Simon provides the traceable chronology—forecasts, discussions, and probability products—from October 7 onward, the institutional backbone of the storm’s record.
Mechanism: how a “non-landfall” still drives damaging coastal hazards
Hurricane categories denote maximum sustained wind at a point near the center; they do not describe rainfall totals, storm surge, wave heights, or the breadth and duration of hazards. The physics explains why a close pass matters. Major hurricanes concentrate their fiercest winds in the eyewall, but the circulation extends far outward, coupling with bathymetry and coastline shape to push long-period swells shoreward and wring moisture out over mountainous terrain. Even with an eye offshore, onshore flow, outer rainbands, and orographic lift can generate flooding and mudslides inland. NASA’s contemporaneous account flagged heavy rain and flooding in coastal zones, elevated landslide risk in adjacent highlands, and dangerous swells along reaches of southwestern and west-central Mexico—hazards entirely consistent with a major hurricane paralleling the coast.
The advisory record complements that picture. While the storm’s peak winds diminished after the close pass, the wave field and rainfall impacts lag maxima in wind because ocean response builds over time and precipitation depends on moisture flux and terrain interaction. This is why a storm that “stays offshore” can produce localized emergencies on land, and why emergency managers focus on compound risk rather than category alone—wind, water, and exposure are distinct levers of harm.
Timing, intensity labels, and why reports don’t contradict
Seemingly divergent descriptors—Category 4 at peak, then Category 2 in later advisories—reflect different snapshots in a dynamic system, not factual conflict. NASA’s report anchors October 11 conditions with satellite confirmation near the closest approach; the NHC advisories on October 13 capture the storm after structural changes and cooler waters reduced its winds. The Associated Press, citing the NHC’s Sunday outlook, likewise described Simon as a Category 4 hurricane expected to pass very near the coast and remain close into Monday, mirroring the timing of the documented peak.
This is the perennial communication challenge: the Saffir–Simpson scale is a wind scale. It does not encode rainfall or surf risk, and it certainly does not adjudicate whether an offshore pass is safe. A weaker, slow-moving cyclone over vulnerable terrain can cause more flooding damage than a stronger storm that stays at sea; conversely, a high-end hurricane brushing the coast can deliver days of hazardous surf and episodic flash floods. In practice, hazard messaging must braid together category, track, forward speed, size, and local geography.
Track and landfall: what did and did not happen
The evidence base supports a close offshore passage without a confirmed landfall in Mexico during the documented window. NASA’s narrative places the eye offshore during the October 11 overpass; subsequent NHC positions keep the center west of Cabo Corrientes through October 13. Those records are coherent with a non-landfall scenario, even as impacts came ashore via rainbands and swells.
This distinction matters for two reasons. First, landfall has a specific definition—when the center of the circulation crosses the coastline—which can be a poor proxy for who is harmed. Second, recovery planning and claims analysis frequently hinge on landfall status, even though surge and freshwater flooding can be severe in an offshore pass. Understanding the line between center-crossing and hazard footprint prevents misinterpretation of risk and, downstream, misallocation of resources.
Two tropical systems are currently active in the Pacific Ocean. Hurricane Simon continues to move along the coast of Mexico and is expected to weaken to Tropical Storm Strength before making landfall. Tropical storm Trudy is expected to intensify over the coming days to become a… pic.twitter.com/qpnR0atBVA
— BAM Weather (@bam_weather) October 14, 2026
Forecast confidence and the arc of Simon’s evolution
Simon’s intensity and track changes challenged expectations, and by October 13, forecast confidence—how much forecasters trust their model consensus—was described as low. That is not unusual in the Eastern Pacific, where oceanic eddies, dry-air intrusions, and eyewall-replacement cycles can drive rapid swings. The NHC archive provides the full sequence of discussions and updates that operational centers use to communicate that evolving confidence, while still anchoring public messaging in concrete hazards: rainfall ranges, surf advisories, and wind probabilities.
Why this template matters beyond one storm
Simon’s record is a textbook case study for coastal risk communication. First, treat “Category” as just one lens; major hazards—rain, surf, landslides—are orthogonal to the wind label. Second, focus on geography: an eye offshore by tens of kilometers can still align the worst quadrants to drive surf and rain inland. Third, follow institutional records for timing: satellite overpasses, aircraft reconnaissance, and advisory timestamps explain why an evening headline and a next-morning bulletin can both be right yet describe different intensities. Finally, read the advisory suite as a system—public advisory, forecast discussion, and probabilistic products—to track not just the most likely outcome but the plausible envelope around it.
Sources:
science.nasa.gov, goes.noaa.gov, nhc.noaa.gov, apnews.com